
Dogecoin (DOGE) is pressing into a technical inflection that, according to independent chartist Cantonese Cat (@cantonmeow), will either conclude the current upswing “in 2 months” or extend into a third-wave advance toward roughly $2. “Either the cycle’s over in 2 months, or it’s going to what I think is the next likely wave 3 target at $2 (1.618 of wave 1), give or take,” the analyst wrote on X, sharing a three-chart package that centers on the weekly Ichimoku profile, a daily trendline break, and multi-year Fibonacci levels.
Dogecoin Cycle Collapse Or Wave 3 To $2
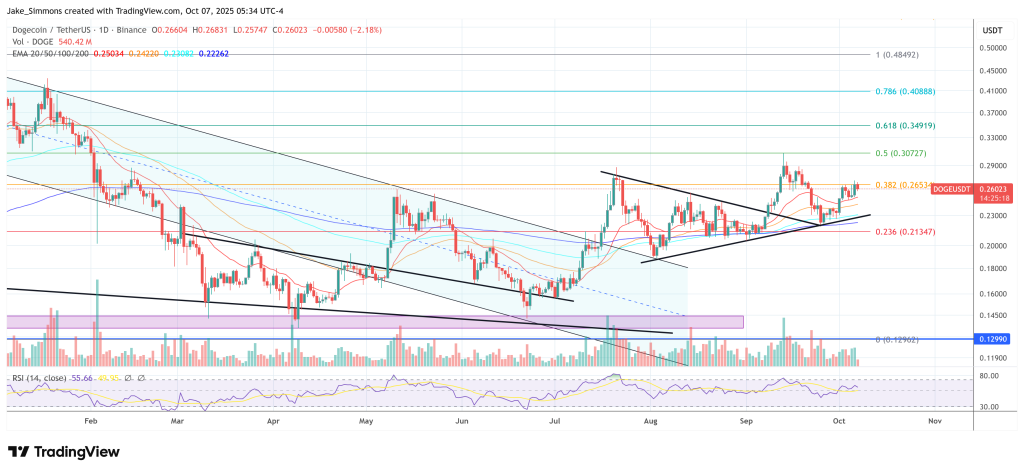
On the weekly timeframe, DOGE is trading around $0.27 and attempting to re-enter the Ichimoku cloud from below. The posted Ichimoku readout shows key levels clustered just above spot: the Tenkan/Kijun pair sits in the mid-$0.22 to mid-$0.25 area, while the forward spans bracket the cloud with an upper boundary near $0.2969.
Related Reading
The chart annotation—“DOGE says it’s raining outside and it wants to get back inside the weekly Ichimoku cloud”—underscores that bulls first need a decisive close back inside the cloud body and then through its top, with the ~$0.30 zone acting as the immediate weekly resistance. A weekly acceptance above the cloud top would mark a regime shift from neutral/resistance to supportive conditions on Ichimoku terms; failure would keep price pinned beneath a heavy ceiling.
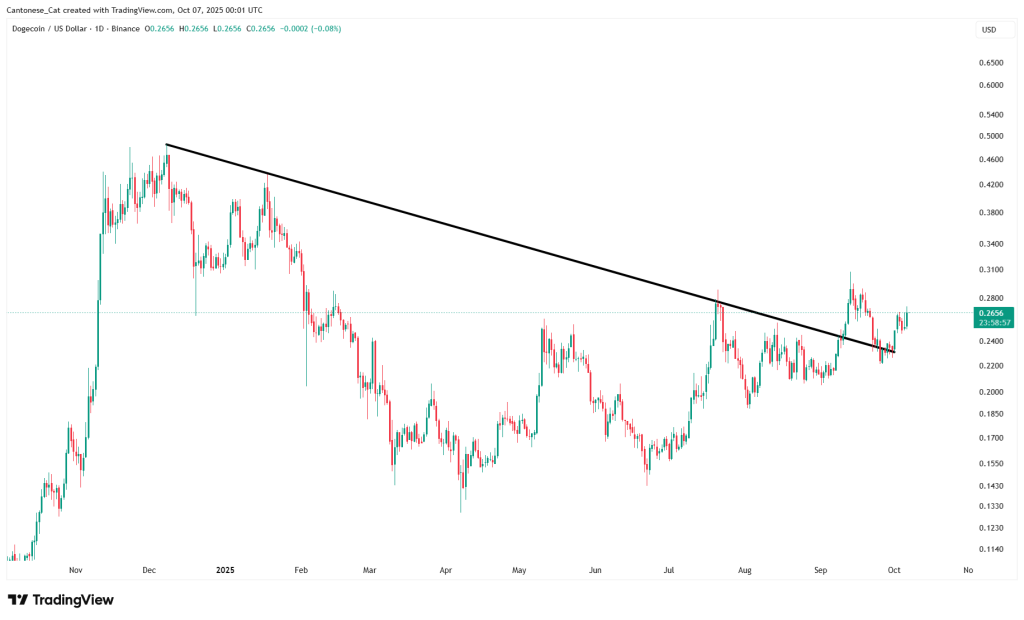
The companion daily chart isolates structure within that broader setup. A long descending trendline drawn from the late-2024 highs is shown breaking to the upside in late Q2, with subsequent price action pulling back to retest the broken line in the mid-$0.24–$0.25 region and bouncing back toward $0.27.
That sequence—breakout, retest, hold—keeps the short-term bias constructive so long as price remains above the reclaimed trendline and the late-September swing-low zone around $0.24. The analyst appended “DOGE daily—No update,” implying the daily structure remains intact and unchanged since the breakout and retest.
The third chart frames the larger roadmap via Fibonacci measures taken from the multi-year base. Labeled retracement lines place 0.236 at $0.0843, 0.382 at $0.1177, 0.500 at $0.1542, 0.618 at $0.2021 and 0.786 at $0.2968, with the “1.0” marker at $0.4844.
Related Reading
Above that, extension objectives plot at 1.272 ($0.9029), 1.414 ($1.2497) and 1.618 ($1.9934). These levels align with the analyst’s stated “wave 3” target near $2, while simultaneously highlighting the significance of the ~$0.30 band: it coincides with the weekly cloud top and the 0.786 retracement.
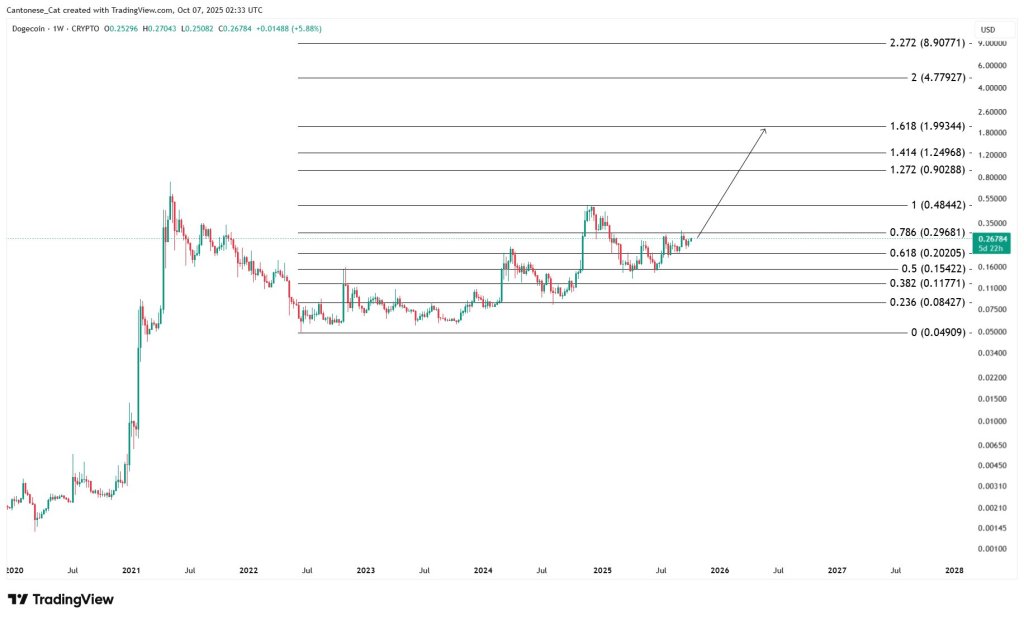
A clean move through $0.2968–$0.30 would therefore open the path toward the 1.0 pivot at ~$0.4844. Conversely, rejection beneath $0.30 keeps DOGE trapped between the cloud underside and daily support, with $0.2021 (0.618) the next major Fibonacci support should the $0.24–$0.25 shelf give way.
In short, the analyst’s two-way framing is anchored in clearly defined technical gates. The upside case requires weekly acceptance back into—and then out of—the Ichimoku cloud, led by a break of ~$0.30 and progression toward the $0.48 “1.0” marker and the $0.90–$1.25 extension band ahead of the 1.618 projection at ~$1.99.
The downside or “cycle done” interpretation would be signaled by failure to hold the daily trendline retest and a slide back through $0.24 toward the $0.20–$0.21 confluence around the 0.618 retracement. For now, DOGE sits mid-range at roughly $0.27, with the cloud top at $0.2968–$0.30 acting as the next decisive test.
At press time, DOGE traded at $0.26.
Featured image created with DALL.E, chart from TradingView.com